
An equity curve and forecast simulator also referred as a Monte Carlo simulation or Montecarlo Method is a tool used in financial analysis and investment planning to model the performance of a trading or investment strategy over time. It provides a visual representation of how an investment or trading account would grow or decline based on historical or simulated data.
Features
- Equity Curve Simulation: The tool simulates the equity curve, which represents the account balance or value over a specified period. It takes into account various parameters, including win percentage, win/loss ratio, risk per trade, number of trades, and more.
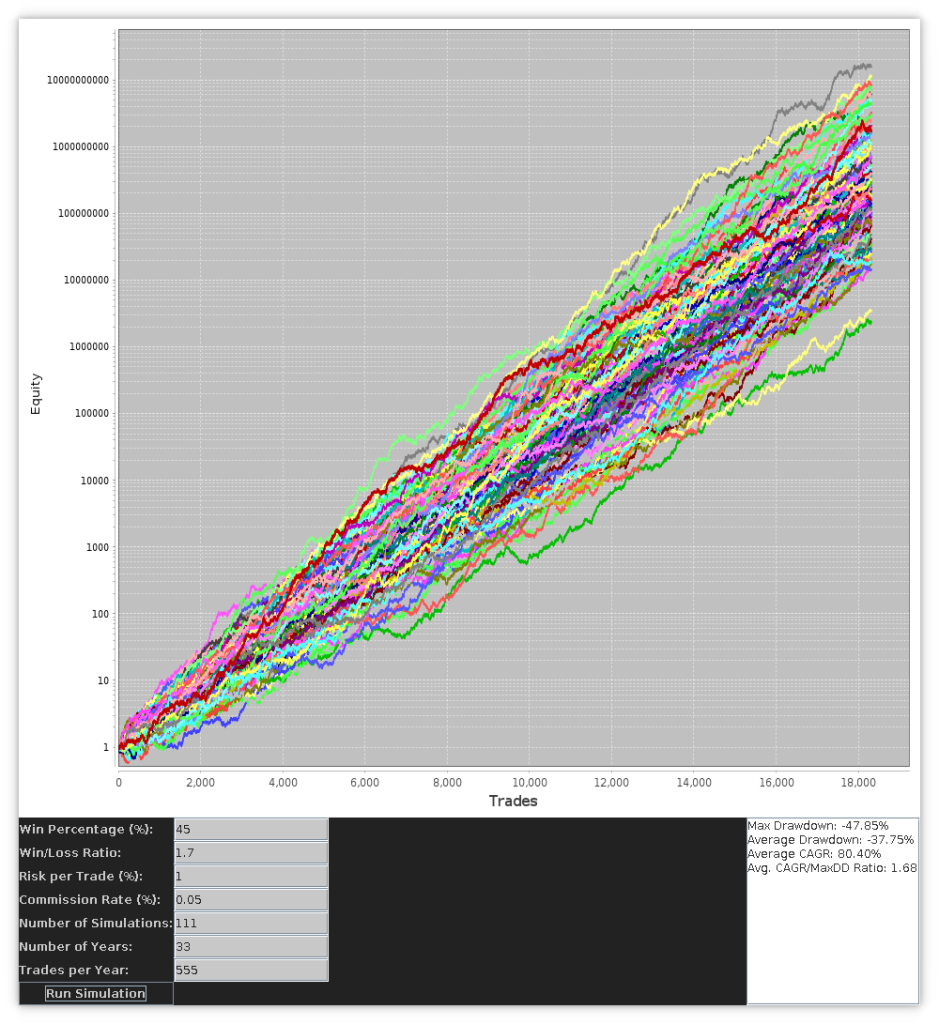
- Multiple Simulations: Allows users to run multiple simulations to observe the variability in outcomes based on random or user-defined scenarios.
- Metric Calculations: Calculates key performance metrics, such as maximum drawdown, average drawdown, average total gain, and Compound Annual Growth Rate (CAGR). These metrics help evaluate the risk and return profile of the trading or investment strategy.
- User Input Fields: Input fields for key parameters enable users to customize the simulation according to their trading or investment strategy.
- Forecasting: Depending on the tool’s capabilities, it may include features for forecasting future equity based on historical data and the specified parameters.
Uses
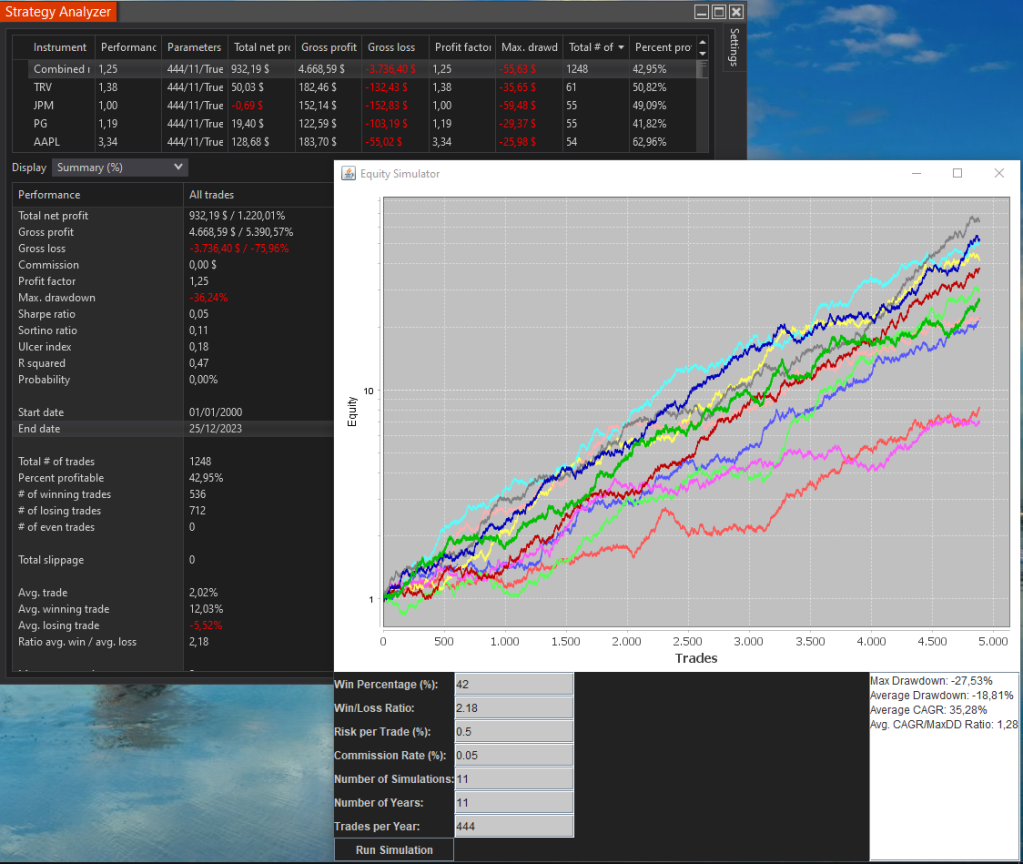
We can take the parameters from the Strategy Analyzer summary and generate a forecast for the desired numbers of trades and years. We can estimate our optimal risk per trade to match a desired annual return (CAGR) and a max drawdown.
It can be used for:
- Strategy Evaluation: Traders and investors can use the simulator to evaluate the historical performance of a trading or investment strategy before implementing it in real markets.
- Risk Management: Assess the risk associated with a strategy by examining maximum and average drawdowns.
- Portfolio risk and concurrent trades. If You trade multiple markets, a portfolio of assets and execute concurrent trades You can asses Your overall portfolio risk and expectancy thanks to the ability of running a forecast over a big number of trades and years.
- Decision Support: Provides decision support by visualizing potential outcomes and helping users make informed decisions about strategy adjustments or portfolio allocations.
- Education and Training: Educational purposes for learning about the impact of various parameters on the equity curve and gaining a better understanding of risk and return dynamics.
- Scenario Analysis: Users can perform scenario analysis by changing input parameters to understand how different market conditions or strategy adjustments might impact performance.
- Portfolio Optimization: Integrate the simulator into portfolio optimization processes to assess the impact of adding or removing specific strategies from a portfolio.
- Performance Comparison: Compare the simulated performance of different trading or investment strategies to identify the most effective ones.
- Long-Term Planning: Investors can use the tool for long-term planning by forecasting potential equity growth based on historical data and assumptions.
In summary, an equity curve and forecast simulator is a versatile tool that aids in analyzing, understanding, and improving trading or investment strategies by providing a visual representation of their historical and potential future performance.
